Industry Facts & Figures
Here we present the results of our 5th survey of the European EO services industry. Previous ones were conducted in 2013, 2015, 2017, 2019 and now 2020. In each case, the date refers to the year of the survey with data from the previous year. It is the first one conducted in what is expected to be an annual cycle with updating of core numbers.
The survey is presented in a series of chapters as indicated to the right presenting facts and figures concerning the state of the industry. A revised methodology has been adopted in order to optimize the analysis to be performed on an annual basis.
A core set of figures will be compiled each year, whilst some will be only assembled biennially. This allows us to keep track of more variables without being over-demanding on the industry each time we ask them to complete the survey questionnaire.
The core of number of companies, employment and revenues will be updated annually.
A new focus this time, made possible by the revised methodology, is the section looking at start-ups. An additional issue is around skills.
Building the database:
- Our database of companies is maintained on a constant basis to add new ones and remove any which disappear through merger or failure.
- Public sources are scanned and monitored for new companies; workshops and conferences, accelerators, ESA BIC’s, members news, trade journals etc.
- Only companies with a legal entity in Europe which is selling services based on EO data are included.
- 32 countries are covered comprising EU and ESA member states.
- Each company has been validated through the national companies register – which also provides the date of formation.
- The company website is reviewed for confirmation that its business includes the sale of services which are based on the use of EO data. Where companies are involved in various parts of the value-chain, this data is noted where possible.
Scope
- Companies offering services or supplying (selling) data or information using satellite (EO) data.
- Private legal-entity in an EU or ESA Member State.
- Survey conducted in 2020 collecting 2019 data.
- Where EO services are only a part of the business model, the proportion of employees linked to this part of the business is determined as far as possible.
Data Collection and preparation:
The data is collected by a series of steps. In moving to an annual survey a focused approach has been adopted so that not all companies are asked to fill in data each year.
- A selected, representative sample of companies from our database are contacted to provide a survey response.
- This data is compared to the same data from 12 months ago to establish industry-wide trends.
- The trend data is applied to our full database which contains the data from previous years’ surveys.
- The data is examined carefully and any perceived anomalies cross-checked to correct false results.
- Additional data may be sought if there are some key parts missing. This will be either gathered directly or it will be purchased from a commercial supplier. This generally yields revenue data.
- For those companies with no revenue data, we calculate an average revenue per head for the different classes of companies.
- For those companies with no employment nor revenue data, we distribute them according to the distribution in the main dataset over micro and small companies and apply average revenues per head.
- Data is consistency checked between each of the surveys.
Data Analysis:
- The first step is to analyse the industrial landscape which may also identify gaps which need to be filled. A cut-off is set for company data which we had entered before the end of the year in question (2019 in this case). This is sorted by country and by year of formation.
- The second step is to assemble the employee information. The latest data is taken based on the final data which had been used in the 2019 survey updated with new data if it has been entered. A comparison is made of like-for-like to establish a growth trend which is applied, by company category, to any data which is more than 2 years old. The companies are classified according to the latest employment figures available. This leads us to establish a “new” final table of employment figures which will also be the starting point next year. For all companies for which no data is available, they are assumed to all be micro or small companies and are distributed to match the known figures.
- The third step is to establish the revenue information. As for the employment figures, the final list of revenues is taken from the last survey and updated where new figures have been provide this year (around 70-80 companies). Average revenues per head for each category of company are used for those companies where no revenue numbers have been obtained. A final table of revenue figures is assembled for all the companies with projected numbers added for all those with no data being available.
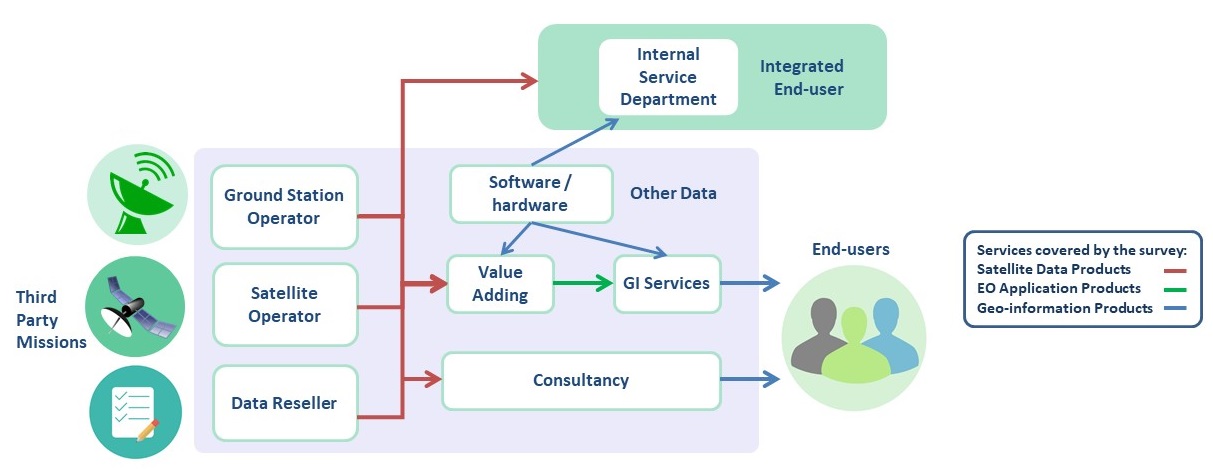
The value-chain defines the scope of the study. All businesses included in the picture to the right are included.
- Satellite data, value adding services and GI services form the core of the value chain.
- Software revenues are included in the core value chain where they arise ie Value-added or GI Services.
- Consultancy is not to deliver EO services but support to the ecosystem (ie studies for ESA or EC).
- Infrastructure as a Service (IaaS) is included for the first time recognising the increasing actors offering cloud or processing services.
- Internal service departments are those where a company in a different sector (e.g. O&G) has an internal unit delivering EO services information to other parts of its business. They are not in the scope of the survey.
The context in which the EO services industry is operating is changing extremely rapidly. Here are a few of the key trends, events etc which are considered relevant in 2019.
- The EC has proposed a new EU Space programme with an overall budget of €16b of which €5.8b is proposed for Copernicus.
- The ESA ministers agreed an ambitious budget for Earth Observation of €2.5b for the next 5 years
- The Copernicus programme continues to have a strong influence on the European EO sector as an important reference customer for data and for services as well as source of free and open data. Five DIAS (Data Access and Information Services) launched in 2018, start to become operational leveraging commercial assets alongside Free and Open Sentinel data.
- Italy launched Prisma as well as a new Cosmo-Skymed Satellite. In the commercial domain there were launches from Iceye, Planet, Blackrock and Spire.
- There were two mergers announced involving European companies namely CLS acquired SIRS and CGI acquired Scisys (UK), In addition in early 2019, Planet announced the acquisition of Boundless Spatial.
Technology continues to evolve at a rapid rate with the latest focus being on Artificial Intelligence as a tool to extract more information, faster from satellite images.
European Industry at a glance
- 5th survey on the state & health of the EO services industry, prepared by EARSC with the support of ESA
- 1st survey in new series of annual updates
- Direct research on over 500 companies; survey sample of 80 companies
713 Companies
11600+ Employees
1.71 billion revenues
>10% growth rate
Number of Companies:
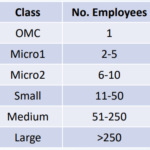
In the industrial landscape we are looking at how companies are formed and distributed within the ecosystem. Included are all European countries which are members of either the EU or ESA – which is a total of 32.
The database includes companies where EO services are a minority part of their business. In this case, we have for the first time included a category of Departments. These are units inside a large company which are selling EO services and would otherwise appear as micro or small in our results.
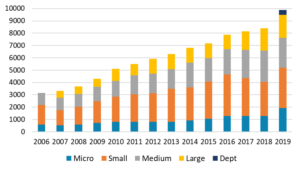
Figure 1. Evolution of the number of companies per company class
The total number of companies included within the 2020 survey is 572 which represents a growth rate of 11% over the last 12 months.
93% of the companies are have less than 50 employees. 70% have less than 10 employees.
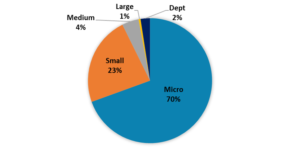
Figure 2. Distribution of companies per class
Formation of Companies:
The year in which a company is formed is of public record. For each company in our database, we can identify its year of formation. From a base of 10 to 15 in the early years of the century, the rate is currently over 40 each year since 2015. A low was reached in 2009 possibly linked to the financial crisis the previous year.
The number formed in the most recent years is certainly higher than we are reporting. This is simply because newer companies are harder to identify until they feature in one of the databases/lists which we monitor (see methodology (1).
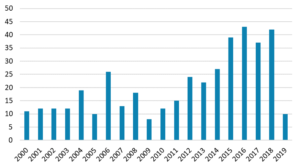
Figure 3. Number of Companies formed each year
Geographical Landscape:
In the industrial landscape we are looking at how companies are formed and distributed within the ecosystem. Included are all European countries which are members of either the EU or ESA – which is a total of 32 countries.
The country hosting the largest number of EO service companies is the UK followed by Germany and France.
UK has been the leading country for companies for some years but is not the leader in terms of employment.
All EU/ESA countries have at least 2 registered EO companies.
![]()
Figure 4. Companies per country
Employment Landscape:
The number of employees in each country follows somewhat the number of companies. However, most employees in the sector are found in France (1794), followed by Germany (1434) and UK(1049) – which differs from the geographical landscape of companies.
The average size of company is larger in France and Germany where Airbus has most employees, than in the UK which has the most companies. Airbus has units or subsidiaries in several European countries which are accounted for in the breakdown.
Only 2 countries, Albania and Bosnia & Herzegovenia (not shown) have no companies or employees. Others e.g. Slovakia, Malta have too few to register on the chart.
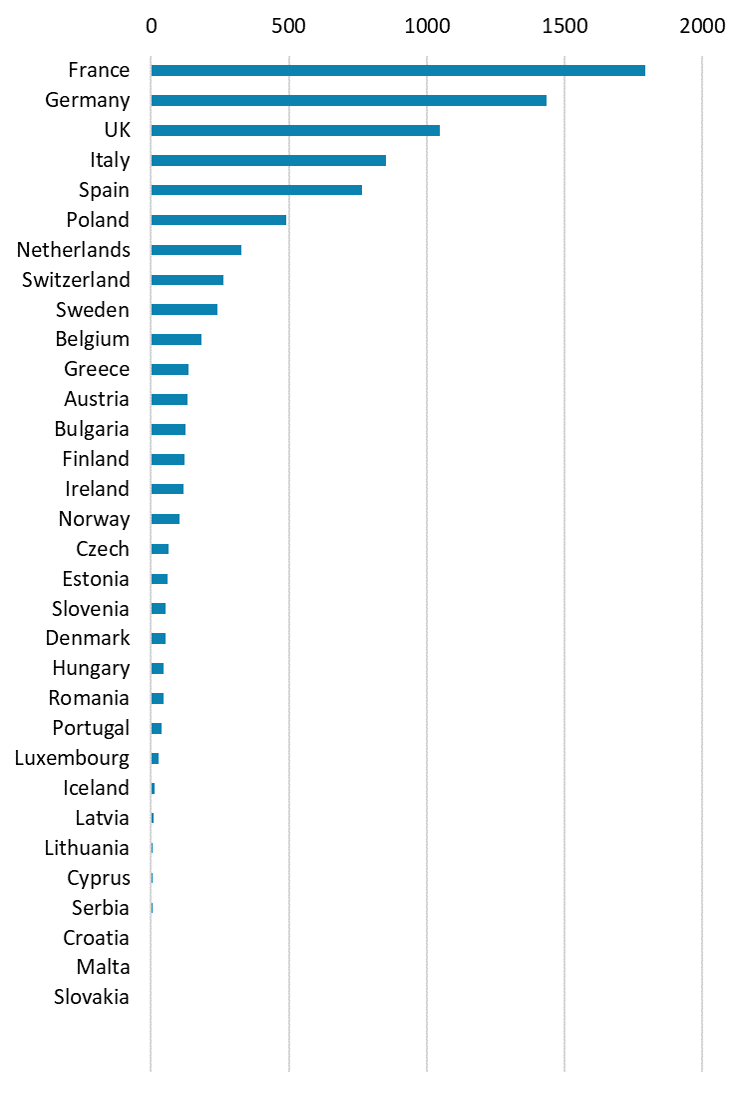
Figure 5. EO Employees per country
Employment Evolution:
The total number of employees in the sector in 2019 is 9876 which represents a growth rate of 17% over the last 12 months.
The total employment in the sector broken down by company class shows a good evolution with a significant increase over the last 12 months of over 17%. We consider that there are two reasons for this large increase:
- The number of micro companies has risen significantly and many of those are growing. Around 50% of the increase in employment numbers is driven by these micro companies.
- A new type of company is entering the sector. IT players offering Infrastructure as a Service (see the value-chain). Our analysis shows around 300 persons are employed in this category which is an increase from the last survey.
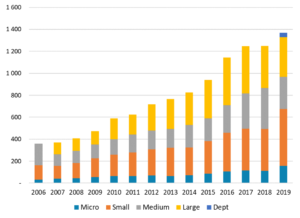
Figure 6. Evolution of EO Employees by company class
Of the total, 8163 or 82% are coming from directly reported employee numbers and 18% from projected numbers. This high number gives good confidence in the results.
Employment Growth rate:
There has been an apparent surge in the level of employment in the sector in Europe with 17% growth over the last 12 months. This follows much lower rates in 2017 and 2018. On a longer term view, the cagr (compound annual growth rate) is around 8% up from 6% last year.
The two main sources of uncertainty in the number of employees comes from the inclusion of new companies in the database and the wrongful identification of employees in larger companies.
With 82% of the numbers coming from directly reported or researched data, it would seem that the annual rate jump is largely genuine coming from a strong growth in micro companies (50% increase in employment) and the inclusion of more Infrastructure as a Service providers being captured by the survey.
The total number of employees in the sector in 2019 is 9876 which represents a growth rate of 17% over the last 12 months.
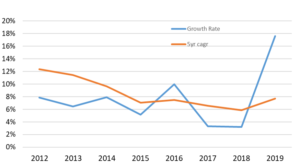
Figure 7. Evolution of employment growth rate
Revenue Evolution:
The total revenues in the sector in 2019 is €1.37b representing a growth rate of 9.7% over the last 12 months. A total of €1.2b or 87% is coming from reported revenues or calculated from employment figures.
The “bump” caused by the WorldDEM contract (discussed in the last 2 surveys 2017 & 2019) is clearly visible from 2015 through to 2017 and whilst we separated it out last time for clarity, now it is just a part of the historic market.
The “Department” category is included for the first time recognising increasing business coming from larger departments inside even larger companies. Note that for Airbus and Telespazio their direct (national) figures are included in our survey and not considered as departments.

Figure 8. Evolution of revenues per company’s class
Revenue Growth rate:
The overall sector revenues continue to grow at around 10% per annum.
The revenue growth rate is rather variable and strongly influenced by large contracts such as the one for WorldDEM in 2014 – 2017. For this reason the cagr is a more reliable measure of the sector.
This has been steady at around 10% over the last 5 years but falling slightly from a high of 14% in 2012. Reference to our 2013 survey will show that we did see a stronger increase at that time following the financial crisis of 2008/9 and the emergence of revenues linked to sales of data.
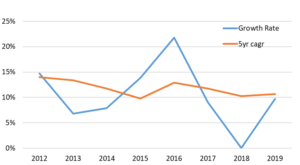
Figure 9. Evolution of revenue’s growth rate
Companies reported on what they perceived as being the main barriers to growth.
The most relevant reported barriers were all linked to customer acceptance and their budgets as well as finding new customers in the first place. Whilst this is a common complaint it also emphasises that companies are looking to expand with new customers rather than trying to sell more services to existing customers.
Lack of staff (see later section on skills) and competition from public bodies came high up the list of barriers.
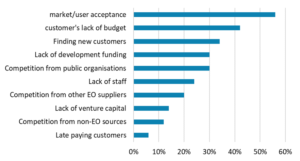
Figure 10. Perceived barriers of growth
SDG’s (Sustainable Development Goals), mandated by the UN are becoming more familiar and more widely accepted by nations as a means to seek sustainable growth.
Many of the SDG’s can be supported through the use of information coming from EO services. And companies are increasingly aware of this as an opportunity.
We found that 55% claim to be delivering services which can help with indicators of progress on one or more of the SDG’s.
Many companies indicated that they would be interested to learn more about SDG’s and how EO can support their implementation and monitoring.
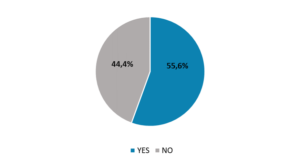
Fig 11. Percentage of companies delivering EO Services for SDGs analysis,monitoring or reporting
Those companies which responded positively were asked which of the SDG’s they were providing services against.
One third of respondents are focused on SDG 13 for climate action.
Some 13% identified life on land (SDG15) and clean water and sanitation (SDG 6) as being addressed.
A further third did not specify which of the SDG’s were addressed or were at a very low level.
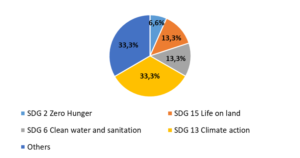
Figure 12. SDGs for which the services are delivered
Copernicus – Use of data and services
The number of companies using Copernicus services has increased.
The number of companies which are not using Copernicus Sentinel data has decreased.
There has been an increase in the use of both Copernicus data and of Copernicus Services over the last 12 months.
Are these numbers significant given the fall we saw earlier between 2016 and 2018 (see figure 18)?
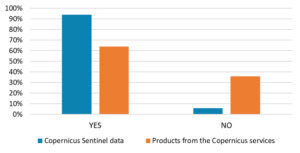
Figure 13. Use of Copernicus data and services
Here we are focused more on the companies which responded negatively which has shown a decrease in each of the 3 years this has been asked.
As a result, we consider that there is a stronger interest in the use of Copernicus by the industry which is probably also a reflection on the increased number of start-ups which we reported earlier.
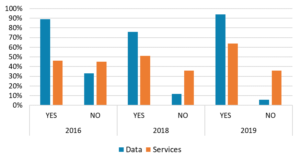
Figure 14. Comparison use of Copernicus data and services
Copernicus Interest
As has been the case in all previous surveys, the main area of interest for companies is the Copernicus Land Service.
50% of those surveyed follow the Land service and either contribute or use the products. It is certainly a majority that either contribute or wish to contribute to the service run by the EEA.
Interest in the Climate service has grown over the last 12 months as it has for security. The latter is a result of the evolution of the security service meeting border requirements.
Interest in the emergency service has fallen presumably as there is a settled supply chain and new companies find it hard to enter into a supplier relationship.
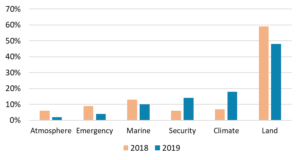
Figure 15. Companies’ interest in Copernicus services
Copernicus – Supply of services
Of the 80 companies responding, 50% are contributing to the supply of Copernicus Services in some way. Over a third of the total are working in the supply of the Land Services – which is consistent with the previous slide/response.
Unsurprisingly, the atmosphere and climate services show the least participation since these are dominated by models and the work at ECMWF.
We anticipate that the level of participation will increase in the security and emergency services whilst for the marine service, the main path for industry lies more in the exploitation of the service rather than in the supply (note however that the use of commercial data may increase).
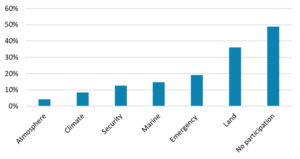
Figure 16. Companies participation to the supply of Copernicus services
Impact of Copernicus on Business
We ask companies their view on the impact of Copernicus on their business. This is a question which has been repeated in each survey and stems from much concern in the sector concerning the impact of the free and open data policy.
The overall sentiment has changed considerably.
The results show not only increasing positive sentiment but also decreasing negative perspective for company’s businesses.
In the latest survey, there is virtually no negative results and only 4% consider that the impact will not be positive in the future.
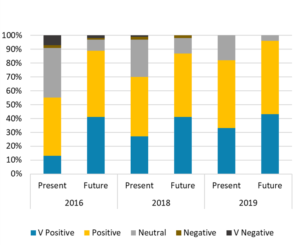
Figure 17. Impact of Copernicus in companies business
Access to Copernicus
For many years, we were challenging the EC and ESA regarding
the access which industry could have to the Sentinel data. This was eventually recognised and led to the creation of the DIAS (Copernicus Data and Information Access Service). Five DIAS were created, each with different business models and technical offers.
Most companies are still using the Open Access hub which is shared by many scientific and international users.
Only 14% are using a DIAS as their favoured way to access data and this is on a par with Amazon Web Services, National hubs and others.
This is similar to the level of use found last year (12% but the difference is not significant).
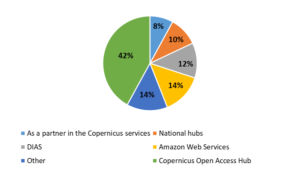
Figure 18. Route most frequently used to access Copernicus data
However, most companies have accessed and tried the DIAS’s with a very high level for all of them. Around 90% have accessed each of the DIAS.
Around 30% of respondents are using one or more of the DIAS for commercial purposes.
The most used is Mundi followed by Creodias and Wekeo.
In a future survey, we could extend the question to see how many companies are using how many DIAS to get a more detailed picture.
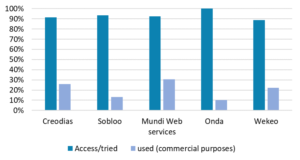
Figure 19. Use of the DIAS
Skills
Access to skills is becoming an issue in the sector and a Sector Skills Alliance of which EARSC is a leading member, is seeking to understand this and what could be done. In the context of the EO4GEO project, we seek to understand companies views. This shows that 80% of the respondents are finding it difficult to find and hire candidates.
In the EO4GEO project, a multi-disciplinary group from industry, academia and policy makers is seeking to create a sector skills alliance to help overcome these difficulties. The sector skills alliance will help academia understand what courses and curricula should be promoted and for the industry to help find good candidates and provide them a fulfilling work environment including training.
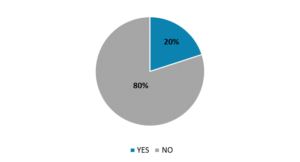
Figure 20. Is it easy to fill in open positions for companies?
Drilling down, we find that among the different skills identified, the most sought-after is programming and development capability. This is followed by analytical capability. It is somewhat surprising that organisational aspects does not feature more highly as companies often cite sector sales knowledge as a key lacuna.
EO*GI sector looks for a workforce not only with up-to-date occupational skills, and especially skills related to data analysis and programming and development, but it also requires transversal or soft skills, such as ‘project management’ ‘team work’ or ‘communication’. The combination of occupational and transversal skills is crucial.
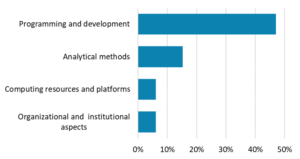
Figure 21. Technical Skills Lacking
Start-ups
The total number of companies formed in the last 5 years is 171 of which we have employment data for 141.
17 (12%) of these are one man companies which we consider as stable meaning that 154 businesses were formed in that time.
Of those for which we have data, 1 has grown into a medium-size company with over 50 employees.
A further 21 have grown into small companies with between 11 and 50 employees.
Of the remaining 102, 68 are employing between 2 and 5 employees and 34 between 6 and 10 employees.
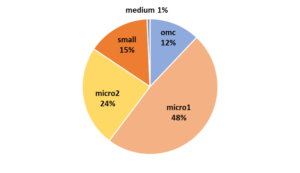
Figure 22. Size in 2019
The breakdown of companies per year of formation shows that 84% of then are micro-sized (10 employees or less) which is higher than the general population of companies.
Of the 21 small companies only 1 has grown to that size in less than 2 years.
The one medium sized company was formed 4 years ago.
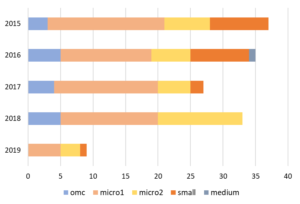
Figure 23. Number of start-ups in year
The growth in employees with time is to be expected.
Companies started in 2015 are now employing 250 persons. Around 60% of the jobs created are from companies formed 4 and 5 years ago.
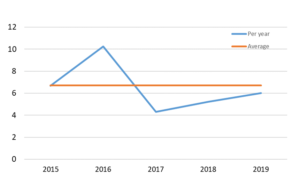
Fig 24. Average number of employees
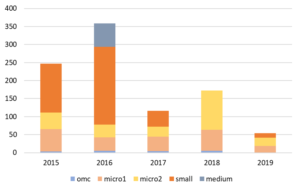
Figure 25. Employees in start-ups
The average number of employees of the new companies in 2019 is 6.7.
This report covers the results coming from the 1st survey conducted at an interval of one year from the previous one. It has not covered all aspects of our full industry survey which will be included when the next one is conducted in early 2021.
The more direct method, introduced for the 2019 survey, has shown its value and we are able to develop a better understanding of some of the dynamics of the sector – especially linked to start-ups.
We anticipated that the shorter interval would not be effective for tracking trends which it is considered accur over a longer period. However, this is not really the case and it must be noted that the jump in the rate of employment in the sector over the 12 month period is not only interesting but could be important. This does show the utility of conducting the survey annually but will be confirmed or not with the next set of results.
The Covid crisis has struck after the results were gathered and whilst the analysis was being conducted. We have not covered any impact as it fell after the survey was completed. It seems highly likely that effects will show up in the next survey and again this perhaps re-enforces the utility of the annual survey.
We shall start the next survey at the end of 2020 and expect to publish results in June 2021.
Any comments or questions relating to this survey please contact us at info@earsc.org