Industry Facts & Figures
The EARSC Industry Survey is a comprehensive annual assessment tracking the trajectory of Europe’s Earth observation (EO) sector. Conducted since 2013, and with its latest iteration in 2023, this survey captures the pulse of over 700 companies, including several EARSC members, through direct research and a sample study. It presents a multi-chaptered analysis, spotlighting critical industry data, such as company count, employment figures, and revenue trends, offering invaluable insights into the EO landscape. Our methodology evolves annually to refine the survey’s efficacy, ensuring it remains a vital benchmark for monitoring the industry’s health and growth. Your feedback continually shapes this survey, empowering us to enhance its scope and relevance year after year.
Building the database:
- Our database of companies is maintained on a constant basis to add new ones and remove any that disappear through merger or failure.
- Public sources are scanned and monitored for new companies; workshops and conferences, accelerators, ESA BIC’s, members news, trade journals etc.
- Only companies with a legal entity in Europe which is selling services based on EO data are included.
- 32+ countries are covered comprising EU and ESA member states.
- Each company has been validated through the national companies register – which also provides the date of formation.
- The company website is reviewed for confirmation that its business includes the sale of services which are based on the use of EO data. Where companies are involved in various parts of the value-chain, this data is noted where possible.
Scope
- Companies offering services or supplying (selling) data or information using satellite (EO) data.
- Private legal-entity in an EU or ESA Member State.
- Where EO services are only a part of the business model, the proportion of employees linked to this part of the business is determined as far as possible.
Data Collection and preparation:
The data is collected by a series of steps. In moving to an annual survey a focused approach has been adopted so that not all companies are asked to fill in data each year.
- A selected, representative sample of companies from our database are contacted to provide a survey response.
- This data is compared to the same data from 12 months ago to establish industry-wide trends.
- The trend data is applied to our full database which contains the data from previous years’ surveys.
- The data is examined carefully and any perceived anomalies cross-checked to correct false results.
- Additional data may be sought if there are some key parts missing. This will be either gathered directly or it will be purchased from a commercial supplier. This generally yields revenue data.
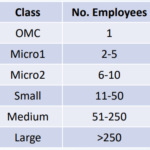
- For those companies with no revenue data, we calculate an average revenue per head for the different classes of companies.
- For those companies with no employment nor revenue data, we distribute them according to the distribution in the main dataset over micro and small companies and apply average revenues per head.
- Data is consistency checked between each of the surveys.
Data Analysis:
- The first step is to analyse the industrial landscape which may also identify gaps which need to be filled. A cut-off is set for company data which we had entered before the end of the year in question. This is sorted by country and by year of formation.
- The second step is to assemble the employee information. The latest data is taken based on the final data with new data if it has been entered. A comparison is made of like-for-like to establish a growth trend which is applied, by company category, to any data that is more than 2 years old. The companies are classified according to the latest employment figures available. This leads us to establish a “new” final table of employment figures which will also be the starting point next year. For all companies for which no data is available, they are assumed to all be micro or small companies and are distributed to match the known figures.
- The third step is to establish the revenue information. As for the employment figures, the final list of revenues is taken from the last survey and updated where new figures have been provide this year (around 70-80 companies). Average revenues per head for each category of company are used for those companies where no revenue numbers have been obtained. A final table of revenue figures is assembled for all the companies with projected numbers added for all those with no data being available.
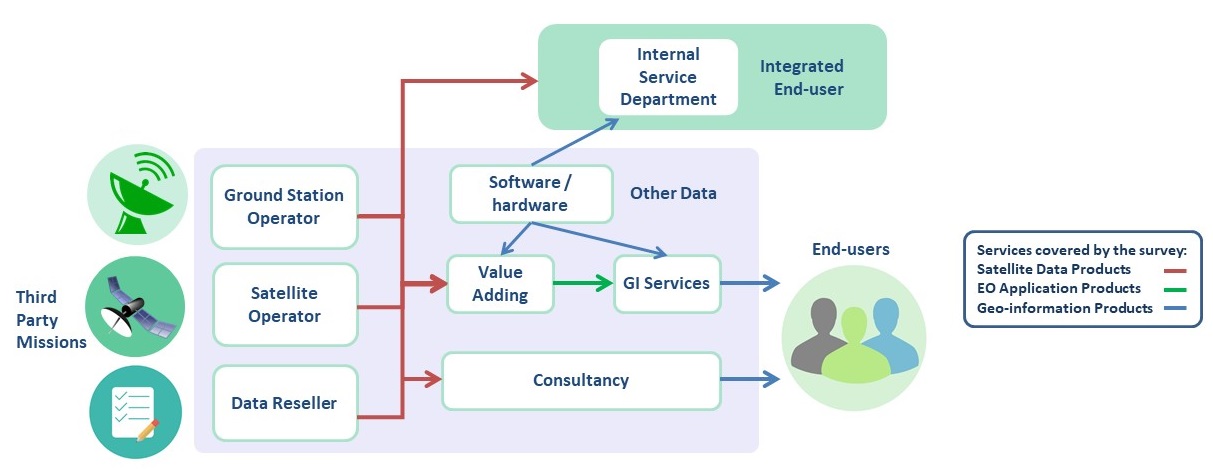
The value-chain defines the scope of the study. All businesses included in the picture to the right are included.
- Satellite data, value adding services and GI services form the core of the value chain.
- Software revenues are included in the core value chain where they arise ie Value-added or GI Services.
- Consultancy is not to deliver EO services but support to the ecosystem (ie studies for ESA or EC).
- Infrastructure as a Service (IaaS) is included for the first time recognising the increasing actors offering cloud or processing services.
- Internal service departments are those where a company in a different sector (e.g. O&G) has an internal unit delivering EO services information to other parts of its business. They are not in the scope of the survey.
European Industry at a glance (2023 Industry Survey data)
772 Companies
13796 Employees
1.79 billion revenues
7,5 % growth rate
EARSC 2023 Industry Survey
Read the previous EARSC Industry Surveys: