- October 12, 2021
- Posted by: EARSC
- Categories: e-shape, Members News
By Kasper Bonte 07.07.2021
About a year ago, we introduced you to the H2020 e-shape project. Based on user need analysis, we started updating and developing agricultural services to monitor and improve sustainable agriculture in Europe. These services were demonstrated to and tested by end users over the past agricultural growing season. As we promised you more details on the outcomes, here’s already a story about crop calendar monitoring, one of the GEOGLAM initiatives to monitor the crop condition at a global scale.
THE IMPORTANCE OF CROP CALENDARS
Annual cropping systems are very dynamic by nature, where changes may occur in a very short time span. Obtaining these crop calendars at the parcel level is receiving more and more attention, and has now also been identified as an Essential Agricultural Variable by GEOGLAM, the Global Agricultural Monitoring Initiative.
This information can be used in a wide array of applications. Yield prediction models, for example, depend on the exact definition of the phenological stage of the crop, in order to properly assess for example the impact of a drought on the expected yield. Governmental bodies, as another example, want to use this information to derive if a cover crop was planted and how long it was present on the field.
To this end, developing crop calendar extraction workflows has been a focal point within the e-shape project, in order to provide this information at the parcel level. Not only was the focus on the methodological developments, but also on how to make these service available on-demand, at the global scale.
EXPLOITING THE ADVANTAGE OF TIME SERIES
High-resolution satellites like Sentinel-1 and Sentinel-2 offer a tremendous wealth of data, with their frequent overpass allowing to asses the current state of the agricultural fields at a sub-weekly scale. These time series offer a big potential for monitoring and detecting what is happening on the field.
Specific phenological stadia or field actions can be picked-up by these time series. Crop calendar events such as crop harvest or emergence, can result in an abrupt change of the spectral signature (Fig. 1). Although you could guess when such a specific event roughly took place, just by looking at the evolution in time, it is difficult to pin-point an exact date on it.
So, how can we turn these satellite time series into useful information to allow an accurate determination of a crop calendar event?
Well, let’s take a look at how it can be done with a concrete example, namely the determination of the harvest date.
As the harvest can be manifested in many different forms, it was defined in this case as the removal of above-ground biomass for annual crops. The first step is to find suitable satellite variables that are strongly impacted by the harvest.
In this case, a combination of both the fAPAR derived from Sentinel-2 and the VH/VV backscatter ratio of Sentinel-1 was selected (Fig. 1).
Both variables are found to be sensitive to crop harvest events in a different way.
The optical based fAPAR can give some info on the biophysical change of the crop, while the SAR-based VH/VV is sensitive to the crop structural change at harvest.
Furthermore, the VH/VV is not impeded by clouds and can give valid data at a regular basis. In the case of the fAPAR, the problem of clouds was resolved since the CropSAR algorithm was used to fill the cloud-induced gaps.
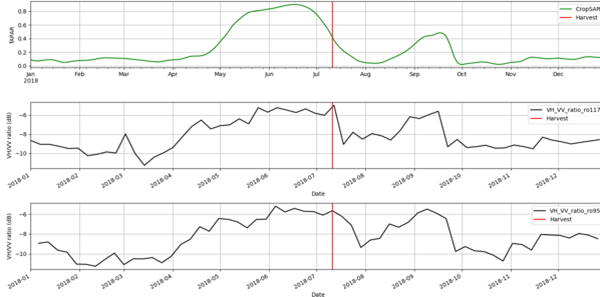
Fig. 1: Time series of used indices for harvest detection for a sugar beet field in Italy. for the VH/VV ratio time series for both the ascending orbit (ro117) as for the descending orbit are illustrated (ro95). The red line shows the actual harvest of the crop. As can be notices both the VH/VV and fAPAR time series show some specific temporal behavior around harvest.
In order to go from the time series of the indices to an exact harvest data, the use of some innovative technologies like neural networks come into play. A neural network was trained in such a way that it provides the probability of a harvest event occurring in a window of 5 consecutive observations. These probabilities are used to make the final harvest date estimation.
Figure 2 illustrates an example of the harvest probabilities resulting from the field on Figure 1.
As can be noticed, the harvest probability is nearly zero outside the harvest period and rises clearly around the harvest period. Furthermore, the model is also able to recognize small harvest events for some catch crops outside the main growing season.
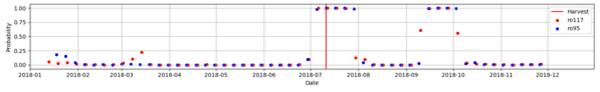
Fig. 2: Time series of the harvest probabilities obtained for the field on Figure 1. The harvest probabilities are predicted at a 5-daily frequency for both VH/VV backscatter data originating from an ascending (ro117) and descending orbit (ro95) and by using the corresponding fAPAR values at the same dates.
But how accurate can we actually predict the crop harvest date?
Based on some additional validation efforts on fields in Belgium, Italy and Greece, the harvest date could generally be estimated within 5-6 days from the actual harvest date.
A more extensive validation will be conducted across different agricultural areas and crop types to further check the prediction accuracy and to assess its robustness.
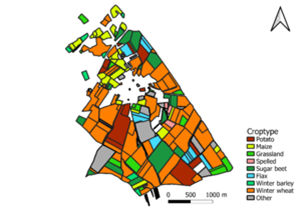
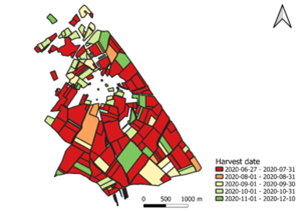
Fig. 3: Left: Predicted crop harvest dates in 2020 for the main growing season for a region in Belgium.
Right: The corresponding crop types that were analyzed. Despite different crop types that were cultivated in this area, the harvest prediction matches quite good with the normal harvest period for the different crop types.
ENABLING A GLOBAL SERVICE
Developing a method to accurately determine the harvest date is one thing, making sure that this method is available as a service to the wider community is another. To this end, additional efforts were undertaken, ensuring a robust and global service.
Many different aspects need to be considered in this exercise, from how to host the service, to where to get the right EO-data from. As pre-calculating the harvest dates on a global scale would be too much of a task, an on-demand web service is most appropriate. For this purpose, we use openEO, which provides a standard API to simplify big EO data processing. On top, a Jupyter Notebook was created to ensure an easy use of the service, even for the non-experts.
Next on the agenda: the expansion of the number of crop calendar events (crop emergence, bare soil exposure) available as a service, as well as the evaluation of the usefulness of these services for a number of user groups.
We’ll keep you posted!